Installation notes for ArcSight ESM 6.9.1 on CentOS 7.1

Aside

Installation of HPE ArcSight Enterprise Security Manager (ESM) 6.9.1 on CentOS 7.1 is substantially easier with engineering adding a “pre-installation” setup script to this version.  For a smooth installation, there are still a few steps we need to take .. outlined below.

  1. Base install of CentOS 7.1, minimal packages but add Compatibility Libraries. Be sure you use the CentOS-7-x86_64-Minimal-1503-01.iso revision since more recent releases of CentOS have other quirks that may make the ESM install or execution fail. Ensure /tmp has at least 5GB of free space and /opt/arcsight has at least 50GB of usable space – I’d suggest going with at least:
    • /boot – 500MB
    • / – 8GB+
    • swap – 6GB+
    • /opt – 85GB+
  2. Ensure some needed (and helpful) utilities are installed, since the minimal distribution does not include these and unfortunately the ESM install script just assumes they are there .. if they aren’t, the install will eventually fail.
    • yum install -y bind-utils pciutils tzdata zip unzip
    • Edit /etc/selinux/config and disable (or set to permissive) .. the CORR storage engine install will fail with “enforcing” mode of SElinux.  I’ll update this at some point with how to leave SElinux in enforcing mode.
    • Disable the netfilter firewall (again, at some point I’ll update this with the rules needed to leave netfilter enabled).
    • systemctl disable firewalld;  systemctl mask firewalld
    • Install and configure NTP
    • yum install -y ntpdate ntp
    • (optionally edit /etc/ntp.conf to select the NTP servers you want your new ESM system to use)
    • systemctl enable ntpd; systemctl start ntpd
    • Edit /etc/rsyslog.conf and enable forwarding of syslog events to your friendly neighborhood syslog SmartConnector (optional, but otherwise how do you monitor your ESM installation?) .. you can typically just uncomment the log handling statements at the bottom of the file and fill in your syslog SmartConnector hostname or IP address. Note the forward statement I use only has a single at sign – indicating UDP versus TCP designated by two at signs:
    • $ActionQueueFileName fwdRule1 # unique name prefix for spool files
      $ActionQueueMaxDiskSpace 1g   # 1gb space limit (use as much as possible)
      $ActionQueueSaveOnShutdown on # save messages to disk on shutdown
      $ActionQueueType LinkedList   # run asynchronously
      $ActionResumeRetryCount -1    # infinite retries if host is down
      # remote host is: name/ip:port, e.g. 192.168.0.1:514, port optional
      #*.* @@remote-host:514
      *.* @10.10.10.5:514
    • Restart rsyslog after updating the conf file
    • systemctl restart rsyslog
    • Optionally add some packages that support trouble shooting or other non-ESM functions you run on the ESM server, such as system monitoring
    • yum install -y mailx tcpdump
  3. Untar the ESM distribution tar ball, ensure the files are owned by the “arcsight” user, then run the Tools/prepare_system.sh to adjust the maximum open files and other requirements that we used to manually update in previous releases.  NOTE: in 6.9.1 there are some previous “shadow” requirements that are now enforced (eg. you don’t get to change) .. such as the application owner account must be “arcsight”, the installation directory must be “/opt/arcsight”.  The “prepare_system.sh” script will check to see if there already is an “arcsight” user and if not, will create it.  I usually manually create all the common users on my various systems since I want them to have the same uid / gid across all my systems.
  4. Run the Tools/prepare_system.sh script as “root” user
    • cd Tools
    • ./prepare_system.sh
  5. Run the ESM install as the “arcsight” user
    • ./ArcSightESMSuite.bin
  6. Download content from the HPE ArcSight Marketplace at https://saas.hpe.com/marketplace/arcsight
  7. Install your ESM 6.9.1 console on Windows, Linux or Mac OS X .. although the web interface is much richer in the last couple releases, you’ll still need to use the console for content creation and editing.
  8. Optionally extend the session timeout period for the web interface.  There still isn’t an easy setting to do this in the GUI, so get into command line on your ESM server and edit or add the following lines .. which indicate the timeout period in seconds.  The default is around five (5) minutes. You should be able to edit these configuration files as the “arcsight” user, but I typically restart the services as “root”.
    • Edit /opt/arcsight/manager/config/server.properties
    • service.session.timeout=28800
    • Edit /opt/arcsight/logger/userdata/logger/user/logger/logger.properties
    • server.search.timeout=28800
    • Restart the ESM services .. I typically run this as “root”
    • /etc/init.d/arcsight_services stop
    • /etc/init.d/arcsight_services start
  9. Optionally configure the manager to display a static banner at the top of each console interface so you can have multiple consoles open and know what manager each is connected to (cool!):
    • Edit /opt/arcsight/manager/config/server.properties and add server.staticbanner.* properties (backgroundcolor, textcolor, text). Both backgroundcolor and textcolor take black, blue, cyan, gray, green, magenta, orange, pink, red, white, yellow as acceptable arguments. Text is the identifier you would like that manager to display, such as “super-awesome-production-box”
    • server.staticbanner.textcolor=green
    • server.staticbanner.backgroundcolor=black
    • server.staticbanner.text=esm691
    • Restart the ESM manager service .. I typically run this as “root”
    • /etc/init.d/arcsight_services stop manager
    • /etc/init.d/arcsight_services start manager
  10. If you are going to install any SmartConnectors on the system hosting your Enterprise Security Manager, check out my post regarding required libraries for CentOS and RedHat, before you try to run the Linux SmartConnector install. This includes any Model Import Connectors (MIC) or forwarding connectors (SuperConnectors).

BlockSync Project

Welcome to the BlockSync Project

This project aims to provide an efficient way to provide mutual protection from deemed bad actors that attack Internet facing servers. The result will be an open source set of communication tools that use established protocols for high speed and light weight transmission of attacker information to a variable number of targets (unicasting to a possibly large number of hosts).

Background

There are many open source firewall technologies in widespread use, most based on either packet filter (pf) or netfilter (iptables). There is much technology that provides network clustering (for example, OpenBSD’s CARP and pfsync; netfilter; corosync and pacemaker), however it’s difficult for disparate (loosely coupled) servers to communicate the identity of attackers in real time to a trusted community of (tightly coupled) peers. Servers or firewalls that use state-table replication techniques, such as pfsync or netfilter, have a (near) real-time view of pass/block decisions other members have made. There needs to be a mechanism for loosely coupled servers to share block decisions in a similar fashion.

Our goal is to create an open source tool for those of us that have multiple Internet facing servers to crowd source information that will block attackers via the firewall technology of choice (OpenBSD/FreeBSD pf/pfSense, iptables, others).

Project Page

All project files are still private yet, but when we publish to GitHub or SourceForge, this section will be updated.

Funding

We have published a GoFundMe page to acquire more lab equipment here at gofundme.com/BlockSync

Using the ArcSight ESM Console to Create Replay Files

HP ArcSight Enterprise Security Manager (ESM) has some built-in capabilities to generate event files suitable for use with the ArcSight Test SmartConnector.  These replay files can be used to test functioning of new ESM content (Dashboards, Datamonitors, Filters, Rules, Queries, Trends, Reports, etc).  The Test connector has some very powerful features including the ability to replay the captured data as is, or to update the date/time stamp on each event to make the data appear as current versus historical data.  The Test connector can also run multiple replay files into it’s configured destinations simultaneously and at a variable rate suitable to support initial content development as well as high speed, high volume performance testing.

Preparing to Generate Replay File

There are multiple ways to generate replay files, but in this post we will focus on use of the ESM console application software to generate the replay file from selected events already existing in the ESM instance.  In order to constrain the events to a selected subset, we need to have a filter prepared to chose the appropriate events.

1-ReplayFileGen  2-ReplayFileGen

For this example, a filter named router4 will be used, where it simply selects all events that have been generated by device name router4 or device address 10.20.1.27

Generating the Replay File

On the workstation or system where the ESM Console software is installed, start the replay file generator with a replayfilegen argument to the arcsight script in the bin directory.  If the console is installed on Linux or Mac OS X, simply use ./arcsight replayfilegen as the command.

0-ReplayFileGen

When the replayfilegen tool starts, it will display a GUI that allows the user to select the target filename to be generated, the timeframe to query and the filter to select the event data.

3-ReplayFileGen

Note that a relative time frame may be specified by using relative start and end time operators – these will calculate the absolute time frames needed.

4-ReplayFileGen

Once the collection has started, there will be a progress display showing the generation of the replay file.

5-ReplayFileGen

Deploying and Using the Replay File

Now the replay file has been generated, the user can simply copy the file to the current directory of the Test SmartConnector. There can be multiple replay files in the current directory and all will be displayed when the Test connector GUI starts.

6-ReplayFileGen

The user can select which replay files are to be read and events forwarded to the Test connector destinations.  Any or all of the replay files may be selected, making the Test connector ideal for assisting in content development for multiple use cases.

7-ReplayFileGen

Once the desired replay files are selected, the events will be replayed to the configured destinations at the rate specified by the user, as soon as the Continue button is pressed.

8-ReplayFileGen

The Test connector will run through all the event data in each selected replay file and stop. By default there will only be one pass through the data files and no event data is altered. ESM Manager Receipt Time will show the current date/time however the original timestamps will be present in the event data.  The event rate can be changed dynamically while the replay is in progress, so for example, some basic event data could be played to the destinations for some time then the user could adjust the event rate substantially higher to speed the event ingest to the destinations.  This is useful for testing use cases where there may be denial of service or worm outbreak detection that is sensitive to event rates.

There are many run-time options that can be set for the Test Connector, including the ability to loop on the replay files, replay the event data with current time stamps and other event handling options.

How To Increase ArcSight ESM Command Center GUI Timeout

In the appliance versions of most ArcSight products, there is the ability to set the user session timeout period. Typically this defaults to somewhere between five (5) and 15 minutes – good for a default but incredibly annoying for any real user.  In ArcSight Enterprise Security Manager (ESM), there is no such GUI configuration that allows modification of the user session timeout – so this is what has worked for me:

Set ArcSight Command Center (ACC) timeout greater than 900 seconds (15 minutes) – set to 28800 seconds (8 hours)
vi /opt/arcsight/manager/config/server.properties
service.session.timeout=28800
/sbin/service arcsight_services stop all
/sbin/service arcsight_services start all

Default is 600 seconds = 5 minutes.

In 6.5, 6.5.1 and 6.8 you also need to add the following for the Logger interface in ESM:

vi /opt/arcsight/logger/userdata/logger/user/logger/logger.properties
server.search.timeout=28800
/sbin/service arcsight_services stop all
/sbin/service arcsight_services start all

Default is 600 seconds = 5 minutes.

Yes, eight (8) hours may seem like a long time, so chose what is appropriate for your site.  🙂

Installation notes for Logger 6 on CentOS

[Update 2016/04/15]:  Installing Logger 6.2 on CentOS 7.1

CentOS (or RHEL) 7 changed a number of things in the OS for command and control, such as the facility to control services – for example, rather than “service” the command is now “systemctl”.  Below I outline a “quickstart” way to get HPE ArcSight Logger 6.2 installed on CentOS 7.1 (minimal distribution). Of course you want to read the Logger Installation Guide, Chapter 3 “Installing Software Logger on Linux” for the complete instructions and be sure you understand the commands I suggest below before you run them. No warranties here, just suggestions.  😉

  1. Do a base install of CentOS (or RHEL) 7.1, minimal packages.  I often suggest adding in Compatibility Libraries, however for this Logger 6.2 install, I just used the base install.  Ensure /tmp has at least 5GB of free space and /opt/arcsight has at least 50GB of usable space – I’d suggest going with at least:
    • /boot – 500MB
    • / – 8GB+
    • swap – 6GB+
    • /opt – 85GB+
  2. Ensure some needed (and helpful) utilities are installed, since the minimal distribution does not include these and unfortunately the Logger install script just assumes they are there .. if they aren’t, the install will eventually fail (such as no unzip binary).
    • yum install -y bind-utils pciutils tzdata zip unzip
    • Unlike my ESM install, for Logger, I left SELinux enabled and things appear to be working alright, but your mileage may vary.  If in doubt, disable it and try again.  To disable, edit /etc/selinux/config and set the mode to “disable” (or at least to “permissive”)
    • Disable the netfilter firewall (again, at some point I’ll update this with the rules needed to leave netfilter enabled).
    • systemctl disable firewalld; systemctl mask firewalld
    • Install and configure NTP
    • yum install -y ntpdate ntp
    • (optionally edit /etc/ntp.conf to select the NTP servers you want your new Logger system to use)
    • systemctl enable ntpd; systemctl start ntpd
    • Edit /etc/rsyslog.conf and enable forwarding of syslog events to your friendly neighborhood syslog SmartConnector (optional, but otherwise how do you monitor your Logger installation?) .. you can typically just uncomment the log handling statements at the bottom of the file and fill in your syslog SmartConnector hostname or IP address. Note the forward statement I use only has a single at sign – indicating UDP versus TCP designated by two at signs:
    • $ActionQueueFileName fwdRule1 # unique name prefix for spool files
      $ActionQueueMaxDiskSpace 1g # 1gb space limit (use as much as possible)
      $ActionQueueSaveOnShutdown on # save messages to disk on shutdown
      $ActionQueueType LinkedList # run asynchronously
      $ActionResumeRetryCount -1 # infinite retries if host is down
      # remote host is: name/ip:port, e.g. 192.168.0.1:514, port optional
      #*.* @@remote-host:514
      *.* @10.10.10.5:514
    • Restart rsyslog after updating the conf file
    • systemctl restart rsyslog
    • Optionally add some packages that support trouble shooting or other non-Logger functions you run on the Logger server, such as system monitoring
    • yum install -y mailx tcpdump
  3. Update the maximum number of processes and open files our Logger software can use:
    Backup the current settings:
    cp /etc/security/limits.d/20-nproc.conf /etc/security/limits.d/20-nproc.conf.orig
    Drop in new config file (assuming you have copy/pasted the following settings into /root/20-nproc.conf):
    cp 20-nproc.conf /etc/security/limits.d/20-nproc.confContents of the /etc/security/limits.d/20-nproc.conf file becomes:
    # Default limit for number of user's processes to prevent
    # accidental fork bombs.
    # See rhbz #432903 for reasoning.
    * soft nproc 10240
    * hard nproc 10240
    * soft nofile 65536
    * hard nofile 65536
    root soft nproc unlimited

    Reboot to enable the new settings.
  4. Add an unprivileged user “arcsight” to own the application and run as:
    groupadd -g 1000 arcsight
    useradd -u 1000 -g 1000 -d /home/arcsight -m -c "ArcSight" arcsight
    passwd arcsight
  5. Ensure the *parent* directory for the Logger software exists. Standard locations for installation of ArcSight products should be /opt/arcsight, so for example, we’re going to install our Logger software at /opt/arcsight/logger.
    cd /opt
    mkdir /opt/arcsight
  6. Run the Logger installation binary as “root” user
    • ./ArcSight-logger-6.2.0.7633.0.bin
  7. After the installation script completes successfully, you should be able to login to the console via a web browser https://<hostname>
    Default username “admin” with default password “password”. You’ll be forced to change the admin password on login.
  8. If you are going to install any SmartConnectors on the system hosting your Logger, check out my post regarding required libraries for CentOS and RedHat, before you try to run the Linux SmartConnector install. This includes any Model Import Connectors (MIC) or forwarding connectors (SuperConnectors).


[Update 2016/03/11]: Starting with SmartConnector 7.1.7 (I think, might be a rev or two earlier), there are a couple more libraries that are needed to successfully install the SmartConnector on Linux. Include libXrender.i686 libXrender.x86_64 libgcc.i686 libgcc.x86_64
yum install libXrender.i686 libXrender.x86_64 libgcc.i686 libgcc.x86_64

These notes describe an installation of HP ArcSight Logger 6.0.1 on a CentOS 6.5 virtual machine.

For a test install of Logger 6, I built a CentOS vm with the following parameters:
Basic install from the CentOS 6.5 Minimum ISO
1 CPU with 2 cores
4GB memory
80GB virtual disk
1 bridged network adapter
Disk partition sizes:
root fs 6GB, swap 4GB, /home 2GB, /opt/arcsight 50GB, /archive 10GB, free space approximately 15GB

As soon as the system was up, I commented out the archive filesystem (will be re-mounted under the /opt/arcsight/logger directory)
vi /etc/fstab

Installed the bind-utils package so I could use dig and friends, then did a full yum update:
yum install bind-utils ntp
yum update

This turns the system into CentOS 6.6, but that’s still a supported system for Logger, so all’s good.

Next we prepare the system for Logger software install by adding a user and changing some of the system configuration.

Add a non-root user to own and run the Logger application:
groupadd -g 1000 arcsight
useradd -u 1000 -g 1000 -d /home/arcsight -m -c "ArcSight" arcsight
passwd arcsight

Install libraries that Logger depends on:
yum install glibc.i686 libX11.i686 libXext.i686 libXi.i686 libXtst.i686
yum install zip unzip

Update the maximum number of processes and open files our Logger processes can have:
cp 90-nproc.conf /etc/security/limits.d/90-nproc.conf

Contents of the /etc/security/limits.d/90-nproc.conf file becomes:
# Default limit for number of user's processes to prevent
# accidental fork bombs.
# See rhbz #432903 for reasoning.
*          soft    nproc     10240
*          hard    nproc     10240
*          soft    nofile    65536
*          hard    nofile    65536
root       soft    nproc     unlimited

Turn off services we don’t need and turn on the ones we do need. Later we will write some iptables rules so we can turn the firewall back on when we’re done.

chkconfig iptables off
service iptables stop
chkconfig iscsi off
service iscsi stop
chkconfig iscsid off
service iscsid stop
ntpdate name-of-ntp-server-you-trust
chkconfig ntpd on
service ntpd start

All of these steps are packaged up here in centos-setup.shl:
groupadd -g 1000 arcsight
useradd -u 1000 -g 1000 -d /home/arcsight -m -c "ArcSight" arcsight
passwd arcsight
cp 90-nproc.conf /etc/security/limits.d/90-nproc.conf
yum install glibc.i686 libX11.i686 libXext.i686 libXi.i686 libXtst.i686
yum install zip unzip
chkconfig iptables off
service iptables stop
chkconfig iscsi off
service iscsi stop
chkconfig iscsid off
service iscsid stop
ntpdate 0.centos.pool.ntp.org
chkconfig ntpd on
service ntpd start

Turns out since we need 3+GB of free space in /tmp, I needed to extend the root filesystem .. I only allocated 2GB to begin with. Extend the root logical volume (lv_root) by adding 1,000 Physical Extents (4MB each):

Boot into rescue mode .. do NOT mount linux partitions, then drop to a shell

vgs
vgchange -a y vg_swlogger1
lvextend -l +1000 /dev/vg_swlogger1/lv_root
e2fsck -f /dev/vg_swlogger1/lv_root
resize2fs /dev/vg_swlogger1/lv_root

Now reboot and confirm there is at least 4GB of free space in /tmp. Could also have mounted a ram filesystem, but this will do as I’m conserving my memory on the host.

Upload the Logger installer binary and also the license file to the system into root’s home directory (or where you have space).

As root, run the Logger software install:
chmod u+x ArcSight-logger-6.0.0.7307.1.bin
./ArcSight-logger-6.0.0.7307.1.bin

Word of advice .. if doing this in a vm, run the install from the vm console since it’s possible the vm will be busy enough a remote ssh session could get disconnected – and the install will not complete properly.

After the install, we should be able to open a browser by navigating to https://name-of-vm-here

Sign in as arcsight / password then navigate to the System Administration section to change the admin password.

Outbound network traffic with multiple interfaces

Why does Red Hat Enterprise Linux 6 invalidate / discard packets when the route for outbound traffic differs from the route of incoming traffic?

Issue Description
Why does Red Hat Enterprise Linux 6 invalidate / discard packets when the route for outbound traffic differs from the route of incoming traffic?
Why does Red Hat Enterprise Linux 6 differ from Red Hat Enterprise Linux 5 in handling asymmetrically routed packets?

Solution posted at access.redhat.com/site/solutions/53031

Red Hat Enterprise Linux (RHEL) 6 Resolution

Temporary change
To accept asymmetrically routed (outgoing routes and incoming routes are different) packets set “rp_filter” to 2 and restart networking, by running the following commands:

echo 2 > /proc/sys/net/ipv4/conf/default/rp_filter
echo 2 > /proc/sys/net/ipv4/conf/all/rp_filter

Persistent change
To make this behaviour persistent across reboots, modify /etc/sysctl.conf and make the following change prior to reboot:

net.ipv4.conf.default.rp_filter = 2

Root Cause

RHEL6 (unlike RHEL5) defaults to using ‘Strict’ Reverse Path Forwarding (RPF) filtering.

Comments
The sysctl net.ipv4.conf.default.rp_filter selects the default RPF filtering setting for IPv4 networking. (It can be overridden per network interface through net.ipv4.interfacename.rp_filter).

Both RHEL6 and RHEL5 ship with a default /etc/sysctl.conf that sets this sysctl to 1, but the meaning of this value is different between the RHEL6 and the RHEL5 kernel.

How to replay syslog events using the performance testing feature of ArcSight SmartConnectors

Aside

[Updated 2016/08/22]

For testing ArcSight SmartConnector settings or Logger and Enterprise Security Manager (ESM) content, it is quite useful to be able to replay previously captured syslog events.  The built in PerfTestSyslog class in ArcSight SmartConnectors make this easy.

There are several ways to capture syslog traffic into a text file for use in replay scenarios. Below are some methods that I have used – may not be the most elegant, but gets the job done.

Run a packet capture of syslog traffic

On the node that has inbound syslog traffic, run a packet capture using tcpdump:syslog-simulator

tcpdump -nn -i eth0 -s0 -w syslog-traffic.pcap port 514

where eth0 is the network interface receiving the syslog traffic, syslog-traffic.pcap is the resulting pcap format output file of captured events and 514 is the port that syslog traffic is expected to be received.

After capturing a suitable size of events, import the pcap file into Wireshark, click on one of the syslog packets, right click and select Follow UDP stream. A decoded content window will appear where you can select Save As .. and dump it to a sample events file. Ensure to select ASCII versus Raw format. This will be your event input file to feed the PerfTestSyslog function of the ArcSight SmartConnector.

Replaying the syslog events using an ArcSight SmartConnector is controlled via the GUI that is displayed when the PerfTestSyslog class is launched. In my example, I have a Test Connector installed on my current host (RedHat Enterprise Linux, however Windows, Solaris or AIX would work just as well) in the /opt/agents/syslog-udp-1514 directory. This connector is up and running listening on UDP 1514 for syslog messages, however we are also going to use it to feed the syslog event to the same connector. Just think of it in two separate unrelated processes, since you could just as easily use this to feed the syslog events to another host somewhere on the network.

cd /opt/agents/syslog-udp-1514/current/bin
./arcsight agent runjava com.arcsight.agent.loadable._PerfTestSyslog -H 127.0.0.1 -P 1514 -f ~arcsight/udp.txt -x 50

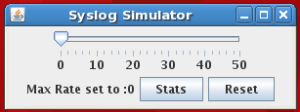
In this example, we are launching the connector framework (./arcsight) and telling the PerfTestSyslog class to read the ~arcsight/udp.txt file (our previously saved syslog events captured with tcpdump) and send them to Host 127.0.0.1 on Port 1514. The last argument is interesting – it configures a slider allowing the user to dynamically increase the Event Per Second (EPS) rate up to a maximum of (in our case) 50 EPS.

A sample capture file has events that look like:

<190>Jun 27 2012 12:16:53: %PIX-6-106015: Deny TCP (no connection) from 10.50.215.102/15603 to 2.3.4.5/80 flags FIN ACK  on interface outside

You can also eliminate the original timestamp if you chose:

%PIX-6-106015: Deny TCP (no connection) from 10.50.215.102/15605 to 204.110.227.10/80 flags FIN ACK  on interface outside

The PerfTestSyslog class has a number of pretty useful options, including -m to randomize the Device Address. This is really good for faking events from multiple firewalls.

Various configuration options exist on both the receiving SmartConnector (that is listening on UDP 1514) and the transmitting program, including the ability to keep the original timestamp intact or replace it with current time. This is especially useful for testing new content or performing historical analysis on previously saved event data where the original timestamp is needed.

Update:

For situations where you would like to run this without a GUI, you can add the -n option to start with No GUI.  In that case, although the rate is no longer dynamic, you do need to specify a starting event rate otherwise it appears the default is 0 .. eg. no events will be sent.  Instead of only specifying -x for max rate, also specify the starting rate with -r

./arcsight agent runjava com.arcsight.agent.loadable._PerfTestSyslog -H 127.0.0.1 -P 1514 -f ~arcsight/udp.txt -n -r 50 -x 50

See also: Common ArcSight Command Line Operations

Malware Investigation Tools and Notes

Investigating possible malware involves both detection and identification phases. Here are some notes regarding the tools I commonly use for these two phases .. note this is intended to be a living document so may change as I learn of new resources or as older resources become stale or no longer very useful.

WARNING: Links shown below may lead to sites with active malware. Do not navigate to any site or link unless you know what you are doing.

Detection

Tools like HP TippingPoint IPS do a good job of detecting vulnerabilities (versus exploits) and also use vulnerability research and lighthouse sensors across the world to confirm infected systems (by IP) and sites (by domain).

Research

Both Google and Scumware have good domain and URL status reporting data.  URL shortening services are notorious for masking domains that have become infected, although there may be a large percentage of legitimate sites to which they refer. An example is the WordPress site wp.me:

http://www.google.com/safebrowsing/diagnostic?site=wp.me

http://www.scumware.org/report/wp.me

 Broad industry trends and general knowledge of attacks, outbreaks and other relevant news can be found on various blog sites:

hp.com/go/hpsrblog


Seagate Disk Replacement and RAID1 mdadm Commands

So I’ve had to replace a Seagate disk yet again and spent a frustrating amount of time on their website looking for a link to their warrenty replacement page >> http://www.seagate.com/support/warranty-and-replacements/

At least this time, I’m using Linux software RAID for a RAID1 mirroring configuration. When I determined there was a disk failure, I used the following mdadm commands to remove the bad drive:

# cat /proc/mdstat
Personalities : [raid1]
md0 : active raid1 sda1[0](F) sdb1[2]
5139084 blocks [2/1] [U_]
md1 : active raid1 sda2[0](F) sdb2[2]
9841585344 blocks [2/1] [U_]
unused devices:

– Fail and remove all /dev/sdb partitions (/dev/sdb1, /dev/sdb2)
# mdadm --manage /dev/md0 --fail /dev/sdb1
mdadm: set /dev/sdb1 faulty in /dev/md0
# mdadm --manage /dev/md0 --remove /dev/sdb1
mdadm: hot removed /dev/sdb1
# mdadm --manage /dev/md1 --fail /dev/sdb3
mdadm: set /dev/sdb3 faulty in /dev/md1
# mdadm --manage /dev/md1 --remove /dev/sdb3
mdadm: hot removed /dev/sdb3

– Shutdown and replace the bad disk (assuming you have been able to replace with the exact disk)
– Copy the partition table from the surviving disk
# sfdisk -d /dev/sda | sfdisk /dev/sdb

– Re-attach the partitions from /dev/sdb to the RAID1 mirrors:
# mdadm --manage /dev/md0 --add /dev/sdb1
# mdadm --manage /dev/md1 --add /dev/sdb2

You should now see the md devices syncing up by:
# cat /proc/mdstat
Personalities : [raid1]
md0 : active raid1 sda1[1] sdb1[2]
5139084 blocks [2/1] [U_]
[======>.......] recovery = 49.3% ...

Once the sync completes, install grub on both the drives again:
# grub
grub> root (hd0,0)
grub> setup (hd0)
grub> root (hd1,0)
grub> setup (hd1)

Great reference pages:
http://serverfault.com/questions/483141/mdadm-raid-1-grub-only-on-sda
https://blogs.it.ox.ac.uk/jamest/2011/07/26/software-raid1-plus-grub-drive-replacement/

Building a web security lab (with VMware Fusion)

Problem: VMware machines load boot loader immediately, no BIOS banner, so can’t get into BIOS to alter boot settings.
Solution: Edit the vm’s .vmx file and add the line:

bios.bootDelay = "5000"

which adds a 5000 millisecond (5 second) delay to the boot, or add:

bios.forceSetupOnce = "TRUE"

to make the VM enter the BIOS setup at the next boot.

Problem: VMware Fusion 3.0 doesn’t give a way to edit the virtual network settings via the GUI.
Solution: To change the subnet used by the NAT or HostOnly networks, go root in Mac OS X and edit

/Library/Application Support/VMware Fusion/networking

and set the following lines to the subnets desired:

answer VNET_1_HOSTONLY_SUBNET 192.168.35.0
answer VNET_8_HOSTONLY_SUBNET 10.10.1.0

To add additional custom isolated host only VLANs, also edit the networking file and add additional VNET definitions. There can apparently only be 8 VLANs with VLAN 1 and 8 already pre-defined.

answer VNET_2_DHCP no
answer VNET_2_HOSTONLY_NETMASK 255.255.255.0
answer VNET_2_HOSTONLY_SUBNET 10.10.21.0
answer VNET_2_VIRTUAL_ADAPTER yes
answer VNET_3_DHCP no
answer VNET_3_HOSTONLY_NETMASK 255.255.255.0
answer VNET_3_HOSTONLY_SUBNET 10.10.22.0
answer VNET_3_VIRTUAL_ADAPTER yes
answer VNET_4_DHCP no
answer VNET_4_HOSTONLY_NETMASK 255.255.255.0
answer VNET_4_HOSTONLY_SUBNET 10.10.23.0
answer VNET_4_VIRTUAL_ADAPTER yes

Now create your vm with as many network interfaces as you have separate VLANs (vnet) then edit the node.vmx vm configuration file and change the interfacename.connectionType to custom, and define the VLAN (vnet) that interface will attach to:

#ethernet0.connectionType = "nat"
ethernet0.connectionType = "custom"
ethernet0.vnet = "vmnet3"

Also realize that VMware will take the .1 host address on each vmnet – so you cannot assign .1 to any of your VMs.

Problem: Ubuntu 9.10 persistent network configuration (stores the MAC address of network adapters), so if you copy a machine, by default Ubuntu will setup a new logical adapter (eth1) since the MAC address has changed (when you answer I Copied It in VMware).
Solution: Tell VMware you copied the machine, so it will chose a unique MAC address. Boot Ubuntu into single user mode (another article on that to follow) then edit the MAC address associated with eth0.

sudo vi /etc/udev/rules.d/70-persistent-net.rules

find the stanza of the network interface in question (NAME=”eth0″) and set the following ATTR tag to the new MAC address:

ATTR{address}=="new-mac-address-here"